Mugl File Reference
The core elements of a Multigraph XML file.
The Window Element
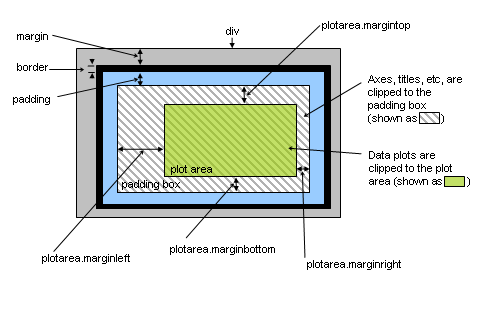
The optional <window> element customizes the default border, margin, padding box, and plot area regions. The window can be thought of as a set of (mostly invisible) nested rectangles inside of a block-level <div> element. See the figure in the following section for an illustration.
<mugl>
 <window
     width="INTEGER"
     height="INTEGER"
     border="INTEGER(2)"
     bordercolor="COLOR(black)"
     margin="INTEGER(2)"
     padding="INTEGER(5)">
 </window>
</mugl>
Attributes
-
widthheightWidth and height of the graph (in pixels); usually defined with the
data-widthanddata-heightattributes specified in the HTML (or CSS) or with options passed to the Multigraph constructor in JavaScript code. -
borderThe width of the optional border (in pixels) to draw around the graph.
Default:
"2" -
bordercolorThe color to use for the
<window>border. Either an expression of the form 0xRRGGBB or one of the following strings: black, red, green, blue, yellow, magenta, cyan, or white.Default:
"black" -
marginNumber of pixels of blank space to allow on all sides between the window and the border.
Default:
"2" -
paddingNumber of pixels of blank space to allow inside the border; everything else (other than the border) that multigraph draws will be clipped to an imaginary rectangle that is inset by this number of pixels.
Default:
"5"
The Plotarea Element
This element defines attributes about the plot area and padding box. The padding box (which includes the plot area) serves as the clipping region for everything that multigraph draws, including axes, labels, and titles. The plot area is region where data points are drawn. There can be at most one of these elements in a mugl file.
<mugl>
 <plotarea
     marginbottom="INTEGER(35)"
     margintop="INTEGER(10)"
     marginleft="INTEGER(38)"
     marginright="INTEGER(35)"
     border="INTEGER(0)"
     bordercolor="COLOR(0xeeeeee)"
     color="COLOR">
 </plotarea>
</mugl>
Attributes
-
marginbottomOffset from the bottom side.
Default:
"35" -
margintopOffset from the top side.
Default:
"10" -
marginleftOffset from the left side.
Default:
"38" -
marginrightOffset from the right side.
Default:
"35" -
borderThe width in pixels of a border to be drawn around the plotarea.
Default:
"0" -
bordercolorThe color to use for the
<plotarea>border. Either an expression of the form 0xRRGGBB or one of the following strings: black, red, green, blue, yellow, magenta, cyan, or white.Default:
"0xeeeeee" -
colorThe color to fill the background of the
<plotarea>. Either an expression of the form 0xRRGGBB or one of the following strings: black, red, green, blue, yellow, magenta, cyan, or white.Default:
"0xeeeeee"
The Axis Elements
The <horizontalaxis> and <verticalaxis> elements define the location, display properties, data types, and range of values of a graph's axes. A graph can have one or more of both axis elements.
These attribute values determine the way that each kind of axis is displayed relative to the plot area. The position of each axis is relative to an edge of the plot area, but all or part of the axis may lie outside the plot area (in the padding box). In particular, a negative position value represents a distance away from the plot area (into the padding box).
<mugl>
 <horizontalaxis
     id="STRING"
     type="DATATYPE(number)"
     length="RELLEN(1.0)"
     base="POINT(-1,1)"
     anchor="DOUBLE(-1)"
     position="POINT(0,0)"
     min="DATAVALUEORAUTO(auto)"
     max="DATAVALUEORAUTO(auto)"
     minposition="RELPOS(-1.0)"
     maxposition="RELPOS(1.0)"
     color="COLOR(black)"
     linewidth="INTEGER(1)"
     tickmin="INTEGER(-3)"
     tickmax="INTEGER(3)"
     tickcolor="COLOR(black)">

   <title
       base="DOUBLE(0)"
       anchor="POINT"
       position="POINT"
       angle="DOUBLE(0)">
   </title>

   <labels
       format="STRING"
       start="DATAVALUE(0)"
       angle="DOUBLE(0)"
       position="POINT"
       anchor="POINT"
       color="COLOR(black)"
       spacing="STRING"
       densityfactor="DOUBLE(1.0)">
     <label
         format="STRING"
         start="DATAVALUE(0)"
         angle="DOUBLE(0)"
         position="POINT"
         anchor="POINT"
         color="COLOR(black)"
         spacing="STRING"
         densityfactor="DOUBLE(1.0)" />
     <label .../>
     <label .../>
   </labels>

   <grid
       color="COLOR(0xeeeeee)"
       visible="BOOLEAN(false)">
   </grid>

   <pan
       allowed="BOOLEAN(yes)"
       min="DATAVALUE"
       max="DATAVALUE">
   </pan>

   <zoom
       allowed="BOOLEAN(yes)"
       min="DATAMEASURE"
       max="DATAMEASURE"
       anchor="DATAVALUE">
   </zoom>

   <binding
       id="STRING"
       min="DATAVALUE"
       max="DATAVALUE">
   </binding>
 </horizontalaxis>
</mugl>
Attributes
-
idAn identifier that can be used to refer to this axis elsewhere in the mugl file.
Default:
"x"and"y"for horizontal and vertical axes respectively, and then"x1"or"y1","y1"or"y2", etc, for any additional axes. -
typeThe data type for the axis, either
"number"or"datetime".Default:
"number" -
lengthThe length of the axis.
There are two ways to specify the axis length.
The first way is to provide a number between 0 and 1 (in quotes), which represents a fraction of the parallel dimension of the plot area (width for horizontal axes, height for vertical axes). For example, given a horizontal axis, a value of
"1"means that the axis length is exactly the width of the plot area, and a value of"0.5"would mean that the axis is half as long as the width of the plot area.The second way is to give an expression of the form
"A+B"or"A-B". In this case, the first number A represents a fraction of the parallel dimension of the plot area, as above, and the second number +B or -B represents a number of pixels to add or subtract from that length. For example, a length of"1-10"for a horizontal axis would mean 10 pixels less than the width of the plot area. A value of"0.5+20"for a vertical axis would mean 20 pixels longer than half the height of the plot area.If for some reason you want to specify an axis length exactly in terms of pixels, use
"0"for A. For example,"0+200"would give an axis that is 200 pixels long. (Note that you definitely need to specify the0+in this case; if you specify a length simply as"200", Multigraph will interpret it according to the first method above, as 200 times the width or height of the plot area.)Default:
"1.0" -
baseThe location of the base point relative to the plot area.
Default:
"-1 -1"(lower left corner of the plot area)Described in detail in the Axes Positioning section.
-
anchorA number between -1 and 1 (in quotes) indicating the location of the anchor point along the axis.
Default:
"-1"(the left endpoint of a horizontal axis, or the bottom endpoint of a vertical axis).Described in detail in the Axes Positioning section.
-
positionA coordinate pair of pixel offsets.
Default:
"0 0"Described in detail in the Position Attribute section.
-
minmaxThe minimum/maximum data value for the axis; i.e. the data value corresponding to the left (for horizontal axes) or bottom (for vertical axes) endpoint of the axis. If the axis type is
"number", the value is a number. If the type is"datetime", the value is a datetime in the format YYYYMMDDHHmmss.Default:
"auto". (Computed from data set; must be specified when using a custom web service.) -
minpositionmaxpositionIndicates the location along the axis corresponding to the minimum or maximum data value (before any panning or zooming that the user might do). This is expressed in general in the form
"A+B"or"A-B", whereAis a relative coordinate between -1 and 1, andBis an optional pixel offset (default is 0).For example,
minposition="-1+5"corresponds to a point that is 5 pixels to the right of the left endpoint, or above the bottom endpoint;maxposition="1-5"corresponds to a point that is 5 pixels to the left of the right endpoint, or below the top endpoint.Default (
minposition):"-1.0"Default (
maxposition):"1.0"Note: it is possible to specify a
minpositionandmaxpositioncombination in which the minimum position is to the right of, or above, the max position, which will cause the data values along the axis to increase in the opposite direction from usual (increasing leftward for horizontal axes, or downward for vertical axes). This is perfectly valid and will work correctly, but you should make sure that it is really what you want before deciding to make use of this feature, because it is likely to be confusing to users, unless there is a good reason to portray your data in this manner. -
colorThe color of the line to draw for the axis. Either an expression of the form 0xRRGGBB or one of the following strings:
"black","red","green","blue","yellow","magenta",cyan, or"white"Default:
"black" -
linewidthThe pixel thickness of the line to draw for the axis.
Default:
"1" -
tickminThe length, in pixels, of the part of the axis tick marks that extends below the axis.
Default:
"-3" -
tickmaxThe length, in pixels, of the part of the axis tick marks that extends above the axis.
Default:
"3" -
tickcolorThe color of the axis tick marks. Either an expression of the form 0xRRGGBB or one of the following strings:
"black","red","green","blue","yellow","magenta",cyan, or"white"Default:
"black" -
positionbaseDeprecated.
Use the
baseattribute instead to switch a vertical axis to be placed relative to the right edge of the plot area (base="1 -1", for example), or to switch a horizontal axis to be placed relative to the top edge of the plot area (base="-1 1", for example). -
pregappostgapDeprecated.
Axis Sub-Elements
Title
The title for the axis. An axis title is positioned and oriented according to its position, anchor, and angle attributes (see the positioning section for details). The title is positioned relative to the the center of the axis. To prevent a title from being drawn at all, use an empty title tag, i.e. <title/>
Default: the axis id
Attributes
-
positionA pixel offset from the axis center point.
Default: depends on the axis; chosen to look reasonable in most common situations
Described in detail in the Position Attribute section.
-
anchorDefault: depends on the choice and position of the axis.
Described in detail in the Base & Anchor Attributes section.
-
angleDefault:
"0"Described in detail in the Angle Attribute section.
-
baseDefault:
"0"Described in detail in the Base & Anchor Attributes section.
Labels
Specifies how multigraph will draw tick marks along the axes and defines tick mark text labels. Multigraph will attempt to choose the densest tick spacing possible from the defined spacing attribute(s) so that the labels do not overlap. Attributes applied to the <labels> element are applied to all spacing intervals.
Attributes
-
colorThe color of the line to draw for the axis. Either an expression of the form 0xRRGGBB or one of the following strings:
"black","red","green","blue","yellow","magenta",cyan, or"white".Default:
"black"
Sub-Element: Label
To customize specific spacing intervals, leave out a spacing attribute in the <labels> element and define <label> sub-elements each with a single number for the spacing attribute. Any attributes defined in these sub-elements will be applied to a specific spacing interval and override any attributes defined in the parent <labels> element.
The following attributes apply to the <labels> element and any <label> sub-elements.
Attributes
-
spacingDefines axis tick spacing intervals.
When defined in the
<labels>element, the value ofspacingis a list of numbers sorted in descending order, separated by spaces. This list specifies the possible spacings to be used between tick marks on the axis. The default value for a number axis is"100005000200010005002001005020105 2 1 0.10.01 0.001". The default value for a datetime axis is"1000Y500Y200Y100Y50Y20Y10Y5Y2Y1Y6M3M2M1M7D 3D 2D 1D12H 6H 3H 2H 1H"When using
<label>sub-elements, thespacingattribute is a single number, and there is nospacingattribute for the<labels>element. -
startIndicates where tick marks should be aligned on the axis. The location of axis tick marks is determined by
startandspacing. Multigraph will draw tick marks, and labels for them, at locationsT + n*S, whereTis the value ofstart,Sis the value ofspacing, for each integernsuch thatT + n*Sis visible in the graph's padding area.Default:
"0" -
densityfactorNote: this attribute is not yet fully implemented in Multigraph 4.0.
This is a factor that can be used to tweak Multigraph's concept of what constitutes an "optimal" density of labels along the axis. It must be a positive number; values greather than 1 result in more labels, and values less than one result in fewer labels.
Default:
"1.0" -
anglepositionanchorThese determine the location and orientation of each tick mark's label relative to the location of the tic mark itself. See the Axes Positioning section for details.
-
formatString describing the format to be used for tick labels. The syntax depends on the type of the axis. For an axis of type
'number', it should be a C-style "printf" format string, such as'%1d', which is the default. For a'datetime'type axis, it should be a string containing some combination of the following special format characters, each of which should be preceeded by a%. Any characters in the format string that are not preceded by a%are included verbatim in the formatted result.Default (number axis):
"%.1f"Default (datetime axis):
"%Y-%M-%D %H:%i"Character Description Y four digit year d day of month without leading zero h hour of day, 12-hour clock m month number without leading zero N month name, spelled out P AM or PM i minutes v deciseconds (10ths of a second) q milliseconds (1000ths of a second) W weekday name, spelled out Character Description y two digit year D 2-digit day of month with leading zero H hour of day, 24-hour clock M 2-digit month number with leading zero n month name, 3 letter abbreviation p am or pm s seconds V centiseconds (100ths of a second) L newline w weekday name, 3-letter abbreviation
Grid
When this element is defined Multigraph will draw grid lines perpendicular to the axis being customized at the location of each tick mark. If this element is left absent, Multigraph will not draw grid lines along the axis. If you want both horizontal and vertical grid lines, be sure to include a <grid> sub-element in both axis elements.
Attributes
-
colorDefines the grid line color as a hex value.
Default:
"0xeeeeee" -
visibleIndicates whether grid lines should be drawn for this axis. Either
"true"or"false"Default:
"false"
Pan
Used to configure the type of panning that Multigraph allows the user to do for the axis.
Attributes
-
allowedEither
"yes"or"no"Default:
"yes" -
minMinimum data value to ever be displayed for this axis; panning is never allowed to go below this number.
-
maxMaximum data value to ever be displayed for this axis; panning is never allowed to go above this number.
Zoom
Used to configure the type of zooming that multigraph allows the user to do for the axis.
Attributes
-
allowedEither
"yes"or"no"Default:
"yes" -
minmaxThese attributes control how far "in" or "out" the user can zoom on an axis; its value is a distance along the axis, and is the smallest or biggest interval that the user will be allowed to zoom in to.
For a number type axis, this value is just a number, and multigraph will constrain the zooming so that the range of values displayed along the axis is at least or at most that number.
For a datetime type axis, the value should be an interval of time consisting of a number followed by one of the letters 'Y', 'M', 'D', 'H', 'm', or 's', which indicate years, months, days, hours, minutes, or seconds, respectively. For example, a
minvalue of"6M"will cause multigraph to constrain zooming along the axis so that the range of time displayed along the axis is always at least 6 months.Default: unconstrained zooming
-
anchorIndicates a location on the axis about which zooming should be centered. Should be either a data value, or the keyword
"none". If it is"none"then zooming is centered about the location of the mouse cursor when the user first presses the mouse button to begin dragging.Default:
"none"
Binding
Used to "bind" two or more axes together with a linear mapping so that interactive panning and/or zooming causes them to move together. It is typically used to connect axes that represent the same vertical scale with different units, such as celsius and Fahrenheit temperature. It can also be used to connect axes in different graphs that represent the same scale (for example, the horizontal time axis).
This element requires all three of its attributes.
Attributes
-
idIdentifies the binding; it can be any string, and all axes having binding elements with the same
idvalue will be connected to each other. -
minmaxA minimum and maximum value for the binding. Axes bound together in a binding will be connected in such a way that their
maxandminvalues correspond to each other.For example, to bind a celsius temperature axis to a Fahrenheit temperature axis, you could use the binding
<binding id="tempbinding"min="0" max="100"/>on the celsius axis, and<binding id="tempbinding"min="32" max="212"/>on the Fahrenheit axis.The
minandmaxattributes can be any two data values on the axis that determine the linear relationship between an axis and other axes in the same binding. They do not need to correspond to the axis's own min and max values, and in general they will not.
The Legend Element
When a graph has more than one plot, Multigraph automatically adds a legend in the upper-right corner. The <legend> element allows you to control the legend's appearance.
<mugl>
 <legend
     visible="BOOLEAN"
     base="POINT(1,1)"
     anchor="POINT(1,1)"
     position="POINT(0,0)"
     frame="FRAME(padding)"
     color="COLOR(white)"
     opacity="DOUBLE(1.0)"
     border="INTEGER(1)"
     bordercolor="COLOR(black)"
     rows="INTEGER"
     columns="INTEGER"
     cornerradius="INTEGER(0)"
     padding="INTEGER(0)">

   <icon
       width="INTEGER(40)"
       height="INTEGER(30)"
       border="INTEGER(1)">
   </icon>

 </legend>
</mugl>
Attributes
-
visibleA value of
"true"means that the legend should appear, and"false"means that it should not. You can use this attribute to disable the legend in graphs containing more than one plot, or to enable it in graphs containing only one plot. You can also specify"yes"or"no"Default:
"true"if the graph contains more than one plot, otherwise"false". -
rowscolumnsThe legend contains an entry for each plot, laid out in a grid. These attributes determine the number of rows and columns in that grid. If you specify one of these values and not the other, the other will be determined by the number of entries in the legend.
Default:
columns="1"androwsis left unspecified (the legend will be laid out in a single vertical column with one row per entry). If you want a single horizontal legend layout instead, specifyrows="1"and leavecolumnsunspecified. -
borderThe thickness of the border drawn around the legend. Use
"0"to turn off the border.Default:
"1" -
bordercolorThe color of the border.
Default:
"black"(0x000000). -
colorThe color used to fill the background of the legend.
Default:
"white"(0xFFFFFF) -
opacitySets the opacity for the legend. The range of values is from 0.0 to 1.0. This is relevant because depending on where the legend is, it may obscure some parts of the plot data.
Default:
"1.0"(completely opaque: any parts of the plot data that appear behind the legend will not be visible at all) -
cornerradiusDetermines whether the corners of the legend box appear rounded (if it is drawn). If it is greater than 0, then the corners are rounded off using circles whose radius is
cornerradiuspixels.Default:
"0"(corners are right angles). -
paddingAn amount of padding, in pixels, to leave between the edges of the legend box and the entries inside it.
Default:
"0" -
anchorDefault:
"1 1"(upper right corner of the legend is anchored to the base point)Details in the Base & Anchor Attributes section.
-
baseDefault:
"1 1"(upper right corner of the plot area)Details in the Base & Anchor Attributes section.
-
positionDefault:
"0 0"(coordinate offset from default position)Details in the Position Attribute section.
-
frameDetermines whether the legend is positioned relative to the plot area or the padding box. Either
"padding"or"plot"Default:
"padding"Details in the Frame Attribute section.
Sub-Element: Icon
The <icon> element affects the appearance of the individual plot icons in the legend.
Attributes
-
widthheightThe width and height, in pixels, of the icons.
Default:
width="40",height="30" -
borderThe thickness of a border drawn around the icons. Specify
"0"to turn off the icon borders.Default:
"1"
The Plot Element
The data that Multigraph draws into the plot area is organized into one or more "plots." A plot consists of a selection of variables (usually two) to be plotted, along with information about which axes to plot them along, as well as visual attributes of the plot.
A plot is described with a <plot> element. There can be any number (zero or more) of <plot> elements in the file. Multigraph will draw the plots in the order they appear in a mugl file. If a <plot> element is present at all, Multigraph will create a single line plot of the <data> element's first variable on the horizontal axis against the second variable on the vertical axis (or first vertical axis, if there is more than one).
<mugl>
 <plot>
   <legend
       visible="BOOLEAN(true)"
       label="STRING">
   </legend>

   <horizontalaxis ref="STRING">
     <variable ref="STRING" />
     <variable .../>
     <variable .../>
   </horizontalaxis>

   <verticalaxis ref="STRING">
     <variable ref="STRING" />
     <variable .../>
     <variable .../>

     <constant value="DATAVALUE" />
     <constant .../>
     <constant .../>
   </verticalaxis>

   <renderer type="RENDERERTYPE(line)">
     <option
         name="STRING"
         value="STRING"
         min="DATAVALUE"
         max="DATAVALUE">
     </option>
     <option .../></option>
     <option .../></option>
   </renderer>

   <datatips
       format="STRING"
       bgcolor="COLOR"
       bgalpha="DOUBLE"
       border="INTEGER"
       bordercolor="COLOR"
       pad="INTEGER">
     <variable
         format="STRING">
     </variable>
   </datatips>
 </plot>
</mugl>
Plot Sub-Elements
Legend
In addition to the <legend> element at the top level of the mugl file, which controls the overall properties of the legend, each <plot> element may contain its own <legend> element to control how that plot's entry in the legend appears.
The individual plot entries in the legend are laid out in the order in which the corresponding <plot> elements appear in the mugl file. To change the order of the entries in the legend, change the order of the <plot> elements. See the legend documentation for information about the graph's legend.
Attributes
-
visibleDetermines whether the plot is listed in the legend at all. Either
"true"or"false".Default: all plots have an entry in the legend if
<legend>is present. -
labelThe text to be used for the plot's entry in the legend.
Default:
idof the first<variable>sub-element assigned to the plot's vertical axis.
Horizontalaxis
Indicates which variable(s) should be mapped to a horizontal axis on the plot. Most plots will have just one correspondence. To specify multiple correspondences, use a sequence of <variable> sub-elements.
Default: the first <variable> sub-element of the <data> element along the horizontal axis.
Attributes
-
refThe
idof a horizontal axis; must match theidattribute of a top-level<horizontalaxis>element.
Sub-Element: Variable
Specifies a correspondence between a horizontal axis and a value from the <data> element.
Attributes
-
refThe
idof the corresponding<variable>sub-element in the<data>element.
Verticalaxis
Indicates which variable(s) should be mapped to a vertical axis on the plot. Most plots will have just one correspondence, but some may have more than one. For example, a plot with error bars would have two "vertical axis" variables: one for the value, and another for the error amount. To specify multiple correspondences, use a sequence of <variable> sub-elements.
Default: the second <variable> sub-element from the <data> element along the vertical axis.
Attributes
-
refThe
idof a vertical axis; must match theidattribute of a top-level<horizontalaxis>element.
Sub-Element: Variable
Specifies a correspondence between a vertical axis and a <variable> sub-element from the <data> element.
Attributes
-
refThe
idof the corresponding<variable>sub-element of thedataelement.
Sub-Element: Constant
Draws a horizontal line on the graph at a specified location. You can specify styling details for the horizontal line, such as what plot style and colors to use, by using the <renderer> sub-element of the plot element, described below.
Attributes
-
valueThe data value at which the horizontal line should appear.
Renderer
Specifies the graph style to be used for the plot. "Renderers" are objects in the multigraph software that are responsible for drawing data plots. Each one corresponds to a specific plot style, such as points, lines, bars, and so on. See the List of Renderers for full details.
Default: "line"
Attributes
-
typeIndicates the name of the renderer. Supported renderers are shown below.
Default:
"line""band"Fills the region between two data lines with a solid color, and draws a line segment between consecutive data points in each line.
"bar"Standard bar graph.
"fill"Plot lines connecting data points with a solid fill between the lines and the horizontal axis.
"line"Standard line graph.
"point"Data values rendered as points only.
"pointline"Line graph with point values also rendered.
"rangebar"Draws a vertical bar between two data values, and an optional outline around the bars.
Sub-Element: Option
This element customizes visual aspects of the plot. See the List of Renderers details on options for each renderer.
Attributes
-
minmaxThese attributes define an "applicability range" for the option. If the
minattribute is present, it specifies a lower endpoint for the applicability range, and analogously, themaxattribute specifies an upper endpoint. If either of these attributes is omitted, the applicability range is unlimited in the corresponding direction. -
valueThe value of the option.
-
nameThe name of the option. Options vary depending on the chosen renderer.
Datatips
Note: the <datatips> element is not yet implemented in Multigraph 4.0
This element tells Multigraph to display "tooltip"-style popups as the user moves the mouse over individual data points, and indicates the format to use for those popups. This element is optional, and if left absent, no tips will be displayed.
Attributes
-
formatA string that gives the text to be displayed in each datatip popup. Within this string, expressions of the form {0}, {1}, etc will be replaced with the values of the corresponding variable from the plot (with {0} being the first variable, {1} the second, and so on). By defining
<variable>sub-elements, you can define your own format strings. -
bgcolorThe color to use for the background of the datatip.
-
bgalphaThe alpha (transparency) value to use for the background of the datatip.
-
borderThe thickness of a border to draw around the outline of the tooltip rectangle.
-
bordercolorThe color to use for the border.
-
padAn amount of space (in pixels) to leave around the text.
Sub-Element: Variable
Each <variable> sub-element of the <datatips> element indicates a format string to be used when formatting the values of a variable to be used in constructing the datatip.
Attributes
-
formatThe format string to be used for the variable.
The Data Element
The <data> element in the mugl file specifies the data to be plotted. The <data> element is the only element that is absolutely required in a mugl file. It is helpful to think of the data as consisting of a table of values, where each column in the table corresponds to a particular variable, and each row corresponds to a set of values for those variables.
<mugl>
 <data>
   <variables
       missingvalue="DATAVALUE"
       missingop="COMPARATOR">
     <variable
         id="STRING!"
         column="INTEGER"
         type="DATATYPE(number)"
         missingvalue="STRING"
         missingop="COMPARATOR">
     </variable>
     <variable .../></variable>
     <variable .../></variable>
   </variables>

  <!-- Be sure to include only one data source attribute !-->
   <values>
    0,1
    14,2
    7,3
   </values>
  OR
   <csv location="STRING" />
  OR
   <service
       location="STRING"
       format="STRING">
   </service>
 </data>
</mugl>
Sub-Element: Variables
A mugl file's <data> element should begin with a <variables> sub-element that indicates some basic information about the columns in this "table" of data. This element's attributes define global rules for determining when to treat data values as "missing." These rules may be overridden in <variable> sub-elements.
Attributes
-
missingopMultigraph will leave a gap at locations corresponding to missing data points.
missingopis the operation to be used in determining whether a value should be considered missing. Should be one of the strings"lt","le","eq","ge", or"gt", which stand for "less than", "less than or equal", "equal", "greater than or equal", and "greater than", respectively.Default:
"eq"(tests for exact equality) -
missingvalueValue tested against by
missingop. For example, ifmissingopis"le"andmissingvalueis"-9000", then any data values less than or equal to -9000 will be considered missing.Default: none (no data values missing)
Sub-Element: Variable
Information about individual data variables is provided by a sequence of <variable> sub-elements within the <variables> element.
Attributes
-
idAn identifier to be used to refer to this variable elsewhere in the mugl file.
Default:
"x"for the first variable,"y"for the second variable, and"y1","y2", ... for any additional variables. -
columnA number indicating which "column" the variable is in.
Default:
"0"for the first variable,"1"for the second, etc. -
typeThe data type of the variable. Should be either
'number'or'datetime'Default:
"number" -
missingopOperation to be used in determining whether a value should be considered missing. Should be one of the strings
"lt","le","eq","ge", or"gt", which stand for "less than", "less than or equal", "equal", "greater than or equal", and "greater than", respectively.Default:
"eq"(tests for exact equality) -
missingvalueValue tested against by
missingop. Multigraph will leave a gap at locations corresponding to missing data points. For example, ifmissingopis"le"andmissingvalueis"-9000", then any data values less than or equal to -9000 will be considered missing.Default: none (no data values missing)
Data Source Elements
There are three ways to specify data:
- List comma-separated values directly in the mugl file.
- Refer to a comma-separated value (.csv) file.
- Link to a compatible web service that provides the data.
The <data> element must have exactly one of the following sub-elements to define how data values are referenced:
Values
List values directly in the mugl file. The data is structured as set of values per line, with individual values on each line separated by commas.
CSV
This element has a single attribute named location, whose value is name of the csv file.
Service
Fetch the data from a REST web service.
The value of location should be either a root-relative (starting with '/') path, or a path that is relative to the location of the HTML file. The URL should not include the "http://" prefix or a server name. Because of JavaScript security restrictions, the address must be on the same server where the HTML page containing the graph is. See the Writing Web Service Data Sources page for more information.
Attributes
-
locationThe service URL. Multigraph automatically appends the string
$min,$maxto the URL, then replaces$minand$maxwith the minimum and maximum values of the data source's first variable for the requested range. -
formatA format string to be used in formatting the data values that will be substituted for
$minand$maxin constructing request URLs as described above.Default (number):
"%f"Default (datetime):
"%Y%M%D%H%i%s"
The Title Element
This element indicates a title to be displayed in the graph. If the <title> element is not present, no title is drawn. If it is present, the text of the element indicates the text of the title.
NOTE: at the time of this writing, the title element is not fully implemented in Multigraph 4.0. A better way to implement a graph title is to do it outside of Multigraph: create a <div> element outside of the Multigraph <div>, and use CSS to style and position it as desired. (You can even position it to appear as though it's inside the graph, by using relative or absolute positioning.) anchor, base, position, frame: specify the position of the title color: color of the background rectangle to be drawn behind the title opacity: opacity of the title background border: thickness, in pixels, of the border drawn around the title; a value of "0" causes no border to be drawn.
<mugl>
 <title
     base="POINT(0,1)"
     anchor="POINT(0,1)"
     position="POINT(0,0)"
     frame="FRAME(padding)"
     color="COLOR(white)"
     opacity="DOUBLE(1.0)"
     border="INTEGER(0)"
     bordercolor="COLOR(black)"
     padding="INTEGER(0)"
     cornerradius="INTEGER(15)"
     fontsize="INTEGER">
 </title>
</mugl>
Attributes
-
anchorbasepositionframeDetails in the positioning section.
-
bordercolorColor of border around the title
-
paddingAn amount of space, in pixels, to leave inside the border of the title.
-
cornerradiusThe radius, in pixels, of rounding to apply to the corners of the title box.
-
fontsizeThe size of the font to use for the title.
The Background Element
You can specify an alternate background color or an image to be used in the background of a graph with the <background> sub-element. If this element is present at all, it should appear at the top level of the Mugl file, inside the mugl tag.
<mugl>
 <background color="COLOR(white)">
   <img
       src="STRING!"
       anchor="POINT(-1,-1)"
       base="POINT(-1,-1)"
       position="POINT(0,0)"
       frame="FRAME(padding)">
   </img>
 </background>
</mugl>
Attributes
-
colorThe color to use for the graph background.
Default:
"0xffffff"(white).
Sub-Element: Img
Specifies an image to be drawn in the background. If it is present, the image is drawn after the background is filled with the background color, but before everything else is drawn, so the image will appear underneath everything.
Attributes
-
srcThe URL of the image to be used. This URL may be either relative or absolute.
-
colorThe color to use for the graph background.
Default:
"0xffffff"(white). -
anchorDefault:
"-1 -1"(upper left corner)See the Base & Anchor Attributes section.
-
baseDefault:
"-1 -1"(upper left corner)See the Base & Anchor Attributes section.
-
positionDefault:
"0 0"See the Position Attribute section.
-
frameDefault:
"padding"See the Frame Attribute section.
The Throttle Element
Allows Multigraph to enforce constraints on the rate at which it initiates requests to fetch data for <csv> and/or <service> data sources. A mugl file may contain any number of <throttle> elements; each one specifies a regular expression pattern, and a set of constraint values. Multigraph enforces that set of constraints to all URLs it fetches that match the regular expression. If more than one of these elements is present, Multigraph will choose the constraints in the first element in the file whose pattern matches the fetched URL.
A <throttle> element with an empty pattern, or missing pattern attribute, will match any URL, so its constraints will be applied to every outgoing request, unless there is another before it with a pattern that also matches the request URL.
The test for whether a request URL matches a <throttle> pattern is done on the original "location" value for the <csv> or <service> element. For <service> elements, this is before any range values are inserted into the URL, and in both cases, the pattern is checked before a relative URL is rewritten to be relative to the location of the MUGL file.
Throttling only applies to data fetched via a <csv> or <service> data source; it does not apply to any images retrieved by the <background> <img> element.
<mugl>
 <throttle
     pattern="STRING()"
     requests="INTEGER(0)"
     period="INTEGER(0)"
     concurrent="INTEGER(0)">
 </throttle>
</mugl>
Attributes
-
patternThe regular expression (JavaScript syntax) for URLs that this element's constraints should be applied to. This regular expression should NOT include delimiting '/' marks.
-
periodAn interval of time (in milliseconds). No more than (value of
requests) are initiated perperiod.Default:
"0"(no time period-based constraint) -
requestsMaximum number of requests to make per
period.Default:
"0"(no time period-based constraint) -
concurrentMaximum number of outstanding requests allowed.
Default:
"0"(no constraint of concurrent requests)
Positioning
Many visual components in Multigraph are positioned relative to another component. A graph title or legend is typically positioned relative to the entire graph window. A title for an axis is usually positioned relative to the axis, and labels along the axis are positioned relative to the tic marks on the axis. The axes themselves are positioned relative to the plot area. Multigraph uses a common collection of attributes and conventions for relative positioning of various components. One of these conventions is a "relative" coordinate system. The lower-left corner of an element has the coordinates (-1,-1), the upper-right corner has coordinates (1,1), and the center has coordinates (0,0).
Many elements in a Mugl file represent rectangles (such as the plot area or padding box) or line segments (such as an axis) that may be positioned with the base, anchor, position, angle, and frame attributes.
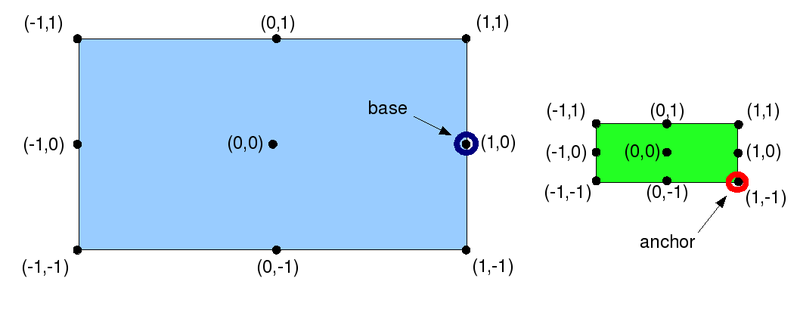
The Base & Anchor Attributes
We specify the location of the green rectangle relative to the blue one by specifying an "anchor" point in the green rectangle with the anchor attribute, and a "base" point in the blue rectangle with the base attribute. The base and anchor attributes in this example would be specified as base="1 0" and anchor="1 -1". When the elements are positioned by Multigraph, the anchor and base points line up with each other (assuming no other positioning attributes are used).
Note: When positioning elements, you're not always dealing with rectangles. For example, in some cases the base point is determined by context and there is no need (or it doesn't make sense) to think in terms of a base rectangle. When positioning an axis title, the base point is the center point of the axis, so the <title> sub-element of the axis element takes position, anchor, and angle attributes that position the title relative to the axis center point, and the base attribute is not needed (or allowed).
The Position Attribute
The position attribute defines a pixel offset from the base point in the form of a coordinate pair. Positive numbers offset the relatively positioned element to the right for a horizontal offset or updwards for a vertical offset; negative numbers offset the element to the left for the horizontal offset or downwards for the vertical offset.
In the above illustration, the base point is (1,0) and the anchor point is (1,-1). The base point is specified in the relative coordinates of the "base" rectangle, and the anchor point is in the relative coordinates of the relatively positioned rectangle. The position vector is about (-30,-20), and would be written as position="-30 20".
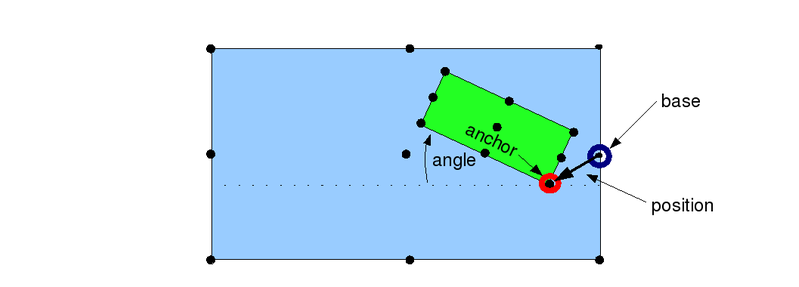
The Angle Attribute
The angle attribute rotates (in degrees) the relatively positioned element. Positive values rotate the element counterclockwise, and negative values rotate the element clockwise.
The Frame Attribute
Some mugl tags accept the frame attribute as a way of identifying the base rectangle. It typically takes values like "plot" or "padding", to indicate that the base rectangle is the plot box or the padding box, respectively. In most cases, though, the base rectangle is determined by the context and there is no need (or allowance) for a frame attribute.
Axes Positioning
When positioning an axis, the base rectangle is the plot area rectangle, and the relatively positioned rectangle is a line segment. Instead of a set of relative coordinates, the anchor attribute then takes a single value: a number ranging from -1 to 1 that represents a location along the line segment. Similarly, when positioning an axis title relative to the axis, the base rectangle is a line segment; in this case the base attribute is a single number between -1 and 1.
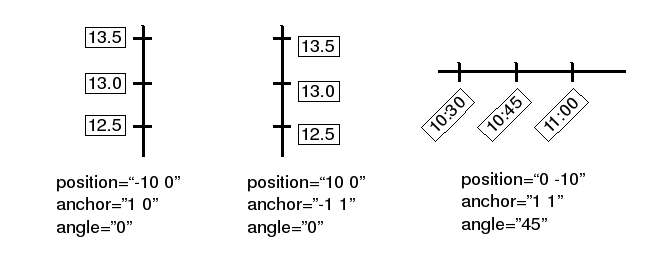
Axis Label Positioning
The <labels> sub-element of the <horizontalaxis> and <verticalaxis> elements allows you to control how Multigraph places tic marks and labels along the axis. The location of the label for each tic mark is determined by the position, anchor, and angle attributes of the <labels> tag. The relatively positioned rectangle is the text label area, and the "base" point for each label is the location of the corresponding tic mark on the axis (the <labels> tag does not take a base attribute).
The following figure shows a few examples of positioning schemes for axis labels. Note that the rectangles drawn around the text in the figure are shown just for clarity; in a real graph, Multigraph does not draw these rectangles.